Client: Farm Mapping Services
Farm management systems require paddock plans with detailed identification of bush, dams, drains, lanes, buildings and more. Farm Mapping Services provide detailed farm maps to farmers across Australia to support a wide range of activities including building paddock histories for stock and crop rotation, control of contractor charges and as a guide to stocking rates.
Digital paddock maps are a key input into these systems however this data is not always available, accurate or up to date. Lynker Analytics recently developed a supervised machine learning based system to identify, detect and delineate paddock boundaries from aerial photography for Farm Mapping Services. The delineation and mapping system was tested using RGB imagery collected at ground sampling distance (GSD) of between 0.7 and 0.4m.
We built a convolutional neural network model with inspiration from the U-Net model architecture for semantic segmentation. Unlike traditional semantic segmentation where the task is to categorise areas of pixels as belonging to a particular class (such as “grass”,”road”,”building”), our objective was to find edges between areas: paddock boundaries. With some adjustments made to our model architecture and training process to meet the delineation requirements, we trained our model on aerial imagery using human captured boundary examples from a diverse range of farms from Tasmania, South Australia, Victoria and New South Wales.
Inference results from the model on two farms in Tasmania are shown below. The brighter the line the more confident the model is. These results show the model has learned simple and complicated multi-type boundaries well however some edges are not as obvious while there exist some false positives within paddocks.

RGB Image (left), model inference result (right)
Overall, we achieved a pixel based model accuracy of 92% - calculated by dividing the number of correct predictions by the number of total predictions.
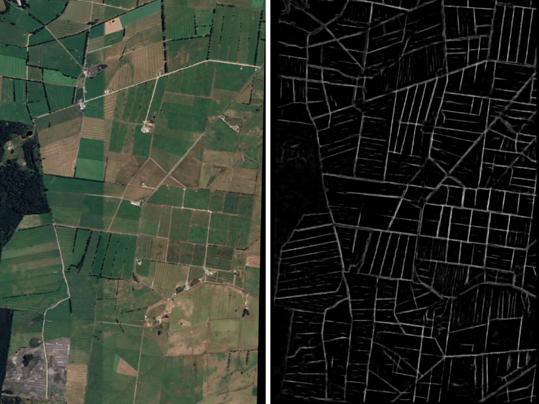
RGB Image (left), model inference result (right)
A multi-stage GIS post processing method was then used to derive paddock geometries that could be used within farm management systems. This process included the following steps:
Raster cleaning,
Vectorisation,
Simplifying and Generalising,
Straightening,
Connecting and Joining Features,
Extracting a final boundary dataset.
Paddock boundaries derived from this process compared to paddocks mapped using manual methods are shown here. The yellow region represents the area predicted by the model to be a boundary with the red centreline derived from this. These boundaries are subsequently processed using the method described above followed by manual QA to produce final paddock boundaries.

Manually mapped paddock boundaries (top) and predicted boundaries (bottom)
This workflow was implemented as a Cloud based ML and processing pipeline to be used on an ongoing basis by the Farm Mapping Services team.
CEO of Farm Mapping Services Andrew Harrisson says
“this automated procedure will help accelerate our farm map update service by reducing the time needed to document farm boundaries, allowing us to focus on pasture management, irrigation and other farming optimisation activities”.
Lynker Analytics and Farm Mapping Services are continuing to invest in this area to improve these capabilities.