Client: Auckland Council
Auckland Council have a requirement to map and monitor changes in land cover and the impervious surface across the city to support a range of activities including catchment planning, hydraulic and contaminant modelling, flood management, and evaluating the impact of proposed developments.
The Council and its predecessor Auckland Regional Council have previously had maps of impervious surface prepared using remote sensing but not a city-wide multi-class data set that discriminates the built surface as well as vegetation, grass, bare earth and water down to a property scale.
In this project Lynker Analytics used Machine Learning to generate a detailed multi-class land cover map across the entire Auckland Council region (approx. 5,000 sq km) covered by the aggregate extent of two aerial photo surveys including the 2010-2012 survey at 0.5m spatial resolution and the 2017 survey at 0.075m spatial resolution.

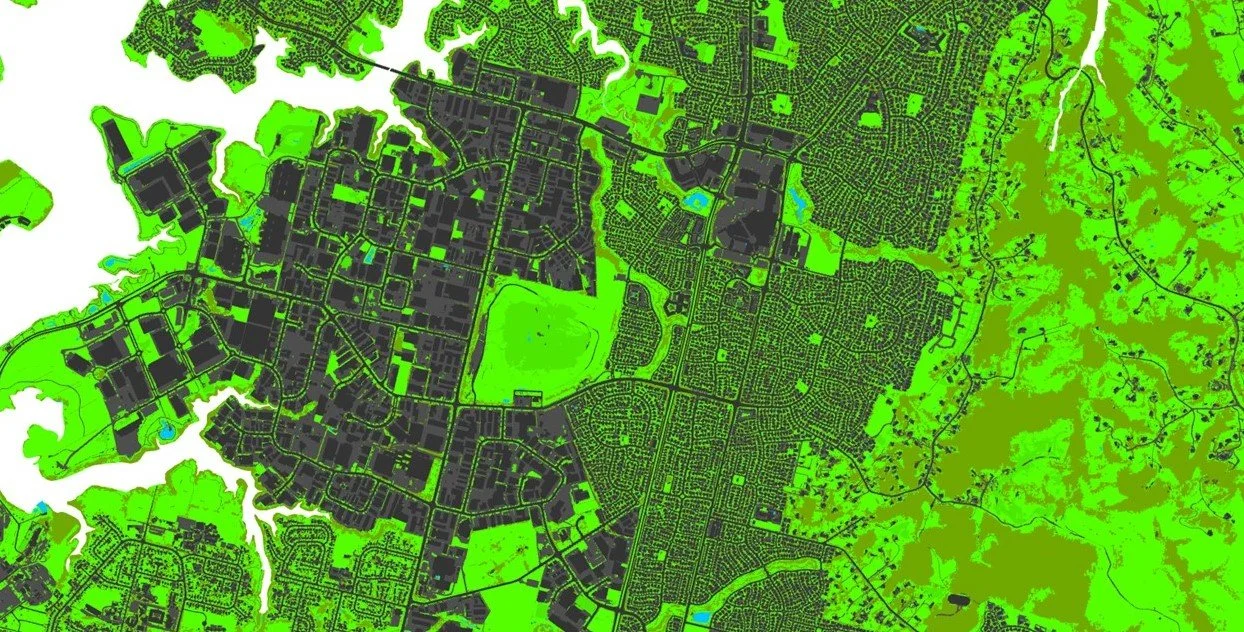
Multi-class land cover, Central Auckland area
Our approach uses supervised Machine Learning (ML) models developed and trained by Lynker Analytics for standard specification orthophotography available in New Zealand. These models have also been used in Hutt City, Upper Hutt City, Tauranga City, Kapiti Coast District, Bay of Plenty, Whangarei District and Gisborne District. ML models can be transferred from area to area or image set to image set but to perform optimally need to be fine-tuned on the target imagery used for modelling.
In this project a DeepLab V3+ neural network model was trained to predict these classes. The urban model was trained and run on the high resolution imagery while a rural model was trained on resampled high resolution imagery and then fine-tuned on the 2010-12 target imagery.
The ML models and post processing generate a polygon feature class which includes eight land cover categories (building, roads, other impervious, grass, scrub/shrub, bare earth/sand/gravel, woody vegetation, water). Detailed Building outlines were generated using a similar but separate process.
Ancillary data such as kerblines, water bodies, and road centrelines were then incorporated within a multi-stage post processing and data assembly process. Quality checks and validation exercises were run to ensure all features were representative and topologically correct. The model accuracy was then evaluated using a separate hold out set of ground truth data carefully selected and not used for training.
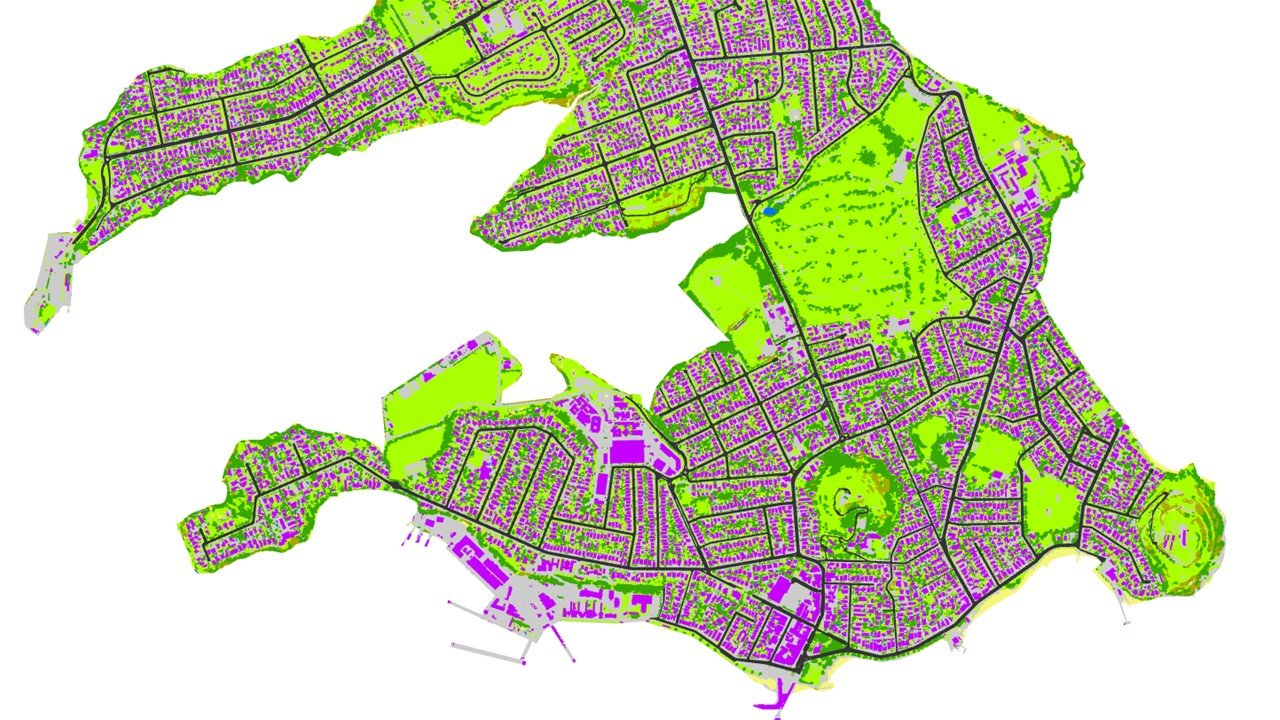
Multi-class land cover, Devonport
Overall, the models performed well across all classes with an overall weighted average F1 score of 0.92. Aside from the Roads class which is sometimes modelled as paved (impervious other) the F1 scores are very good. Also, across all classes the Precision and Recall were high and not too dissimilar which means the model is well balanced.
The detailed land cover models allowed us to map the composite impervious surface – comprising all the artificial structures—such as pavements, roads, sidewalks/footpaths, driveways and parking lots, as well as industrial areas such as airports, ports and distribution centres, all of which have considerable paved areas.
Impervious surface, East Tamaki
The final data is an integrated land cover data set (including the composite impervious area) which is a 100% modelled data set derived from two separate orthophoto surveys.
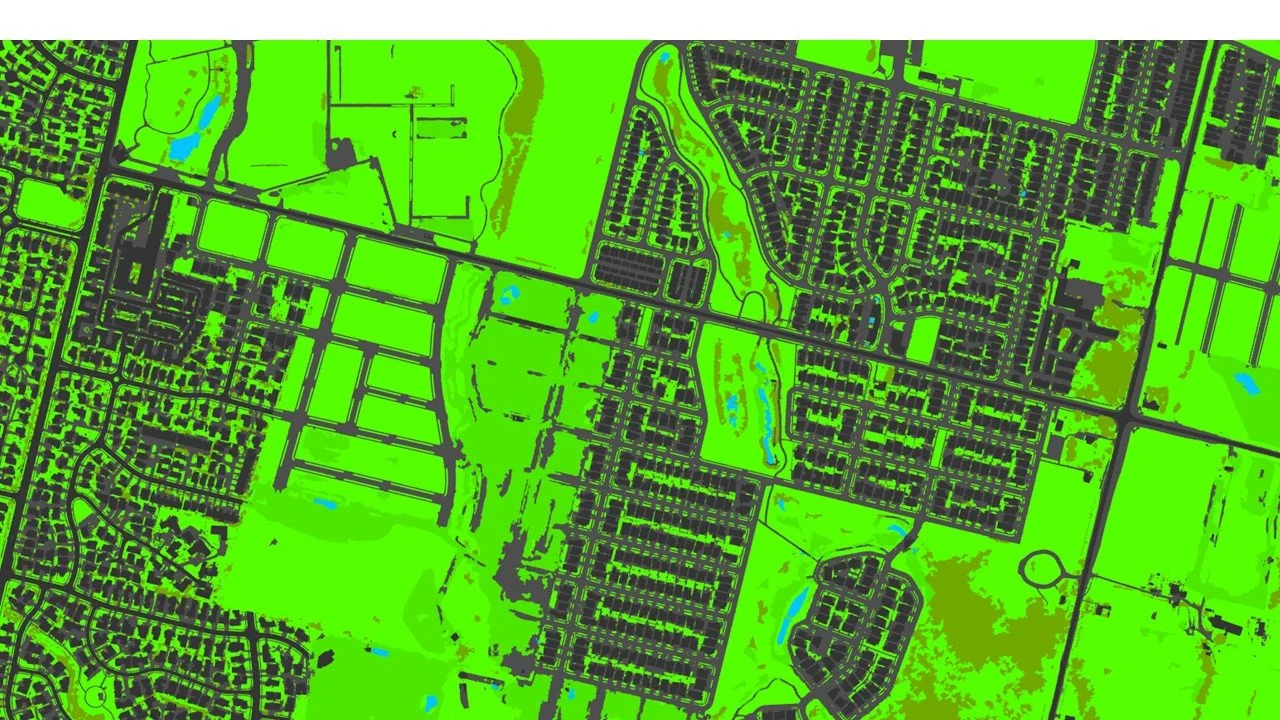
Impervious surface map at suburb scale
False positive classifications generally occur in adjacent classes for example Impervious surface is at times classified as Road or Scrub/Shrub classified as Vegetation or Grass or Bare Earth is classified as Impervious (e.g. compressed gravel). The anthropogenic classes are generally high performing and suitable for modelling the composite impervious surface at a city, suburb and property level.
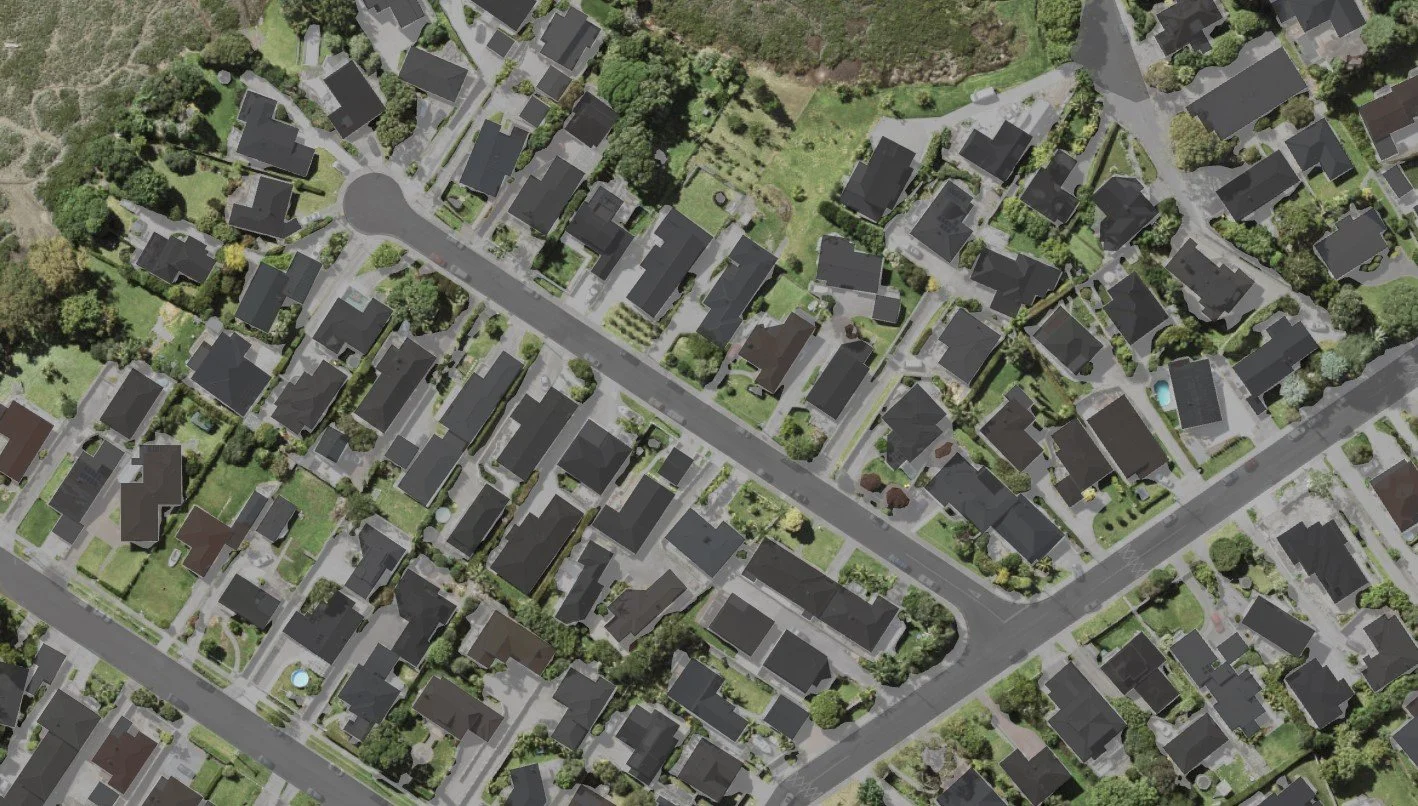
Impervious surface map at street/property scale
The data also allows detailed mapping of tree and shrub canopy across the city which is helpful for planners to understand the cooling, stormwater absorption, and health benefits of urban trees for local residents.

Urban vegetation canopy, Auckland
This work extends previous modelling we have done using urban ortho-photography. We were able to adapt the neural networks we have already built to this image data and multi-class output requirements which will enable future repeat modelling and development of a longitudinal data set of change in land cover and imperviousness across New Zealand’s largest city.
Deliverables
Multi-class land cover GIS data
Impervious surface GIS data
Data accuracy and quality report